鴨子曲線
鴨子曲線(duck curve)是在有使用可再生能源的商業發電中,一天中实际負載(actual load)及净负载(net load)之間的落差。若當地架設了許多太陽能發電設備,在日落後,需要其他發電方式提供的供電量會快速上昇,約在傍晚中間到達最高峰,因此实际負載曲线和可调度电源提供的负载曲线之间會出現鴨子的輪廓[2][3]。在夏威夷,太陽能發電相當普遍,產生的曲線稱為「尼斯曲線」(Nessie curve)[4][5]。
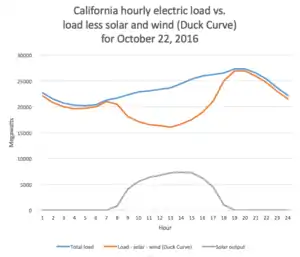
藍線是加州電力負載
橘線是電力負載減去太陽能、風力發電後的净负载(稱為鴨子曲線)
灰線是太陽能發電的能量。
2016年10月22日的資料[1],當天風力發電量不大,日夜的發電量變化也不大。鴨子曲線在17:00至18:00日落時迅速上昇,一小時內發電容量需要增加五十億瓦
橘線是電力負載減去太陽能、風力發電後的净负载(稱為鴨子曲線)
灰線是太陽能發電的能量。
2016年10月22日的資料[1],當天風力發電量不大,日夜的發電量變化也不大。鴨子曲線在17:00至18:00日落時迅速上昇,一小時內發電容量需要增加五十億瓦
參考資料
- . www.caiso.com. [2018-01-23]. (原始内容存档于2019-04-17).
- Paul Denholm, Matthew O’Connell, Gregory Brinkman, and Jennie Jorgenson. "Overgeneration from Solar Energy in California: A Field Guide to the Duck Chart (页面存档备份,存于)" NREL/TP-6A20-65023. National Renewable Energy Laboratory, November 2015
- Wirfs-Brock, Jordan. . Inside Energy . 2 October 2014 [29 October 2016]. (原始内容存档于2020-11-11).
- . The Energy Collective. [2015-02-04]. (原始内容存档于2018-07-03).
- . 10 February 2014 [10 January 2017]. (原始内容存档于2020-11-12).
This article is issued from Wikipedia. The text is licensed under Creative Commons - Attribution - Sharealike. Additional terms may apply for the media files.